Business intelligence that turns Odoo data into decisions managers trust
A dashboard is only useful if the people reading it agree on what the numbers mean. We start with KPI definitions and data quality, then build dashboards for each role inside Odoo or in Power BI.
Business intelligence for an Odoo company means three things: agreed KPI definitions, data models that reconcile with accounting and stock, and dashboards designed for specific decisions. Odoo's pivot views, graphs and spreadsheet dashboards cover many operational needs; Power BI is useful when you combine Odoo with other sources, need heavier modeling or want to share analysis widely. We help you choose and build either.
- Power BI
 PostgreSQL
 Python
 Odoo
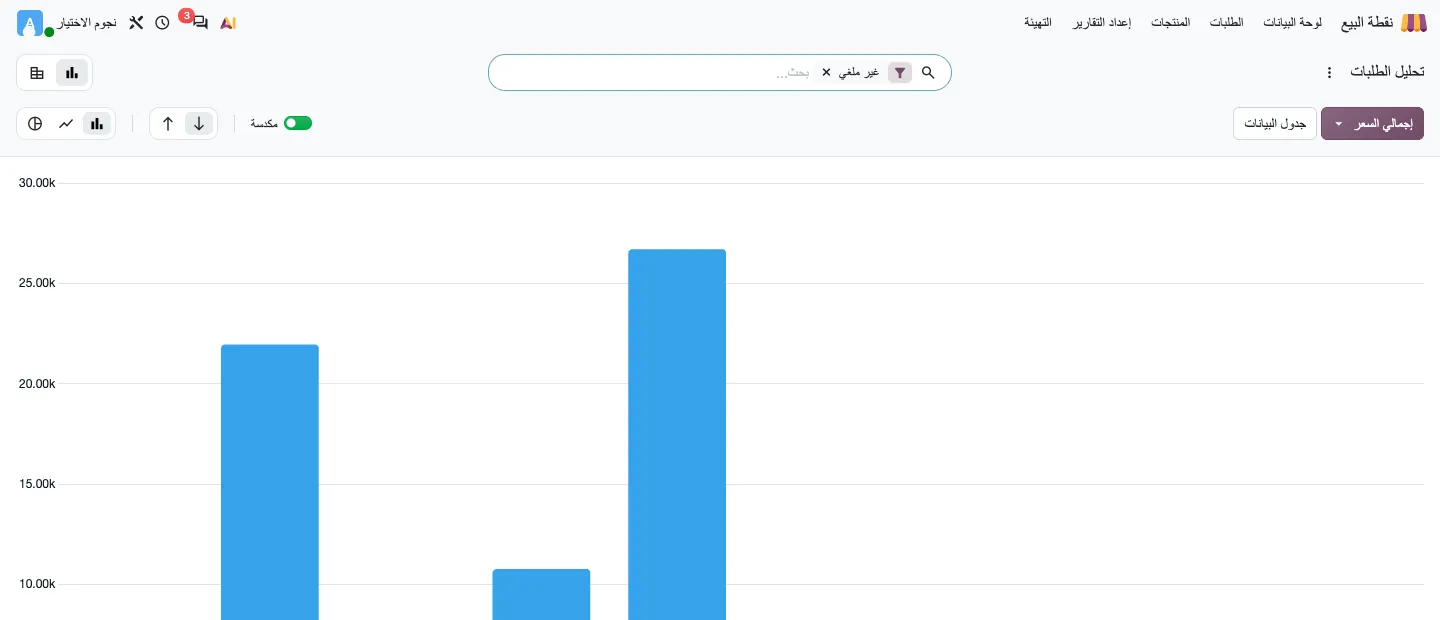
Most reporting problems are data problems
When managers say the report is wrong, the cause is rarely the chart. It is a product posted to the wrong category, a sale recorded without an analytic account, a branch that books expenses differently, or two people using different definitions of gross margin.
We therefore audit the source data and the way transactions are entered before building visuals. Fixes often happen in Odoo itself: mandatory fields, analytic distribution rules, product category accounts or clearer journal structure.
Dashboards by role
Each dashboard answers the questions one role asks every week.
Finance and management
Revenue, gross margin by product line, cash position, receivables ageing and budget versus actual.
Sales
Pipeline by stage, win rate, quotation follow-up, sales by salesperson, region and customer segment.
Inventory and purchasing
Stock value, slow-moving items, stock-outs, supplier lead times and purchase price trends.
Production
Manufacturing order status, planned versus actual material cost, scrap and work center load.
HR
Headcount, attendance exceptions, overtime, leave balances and payroll cost by department.
Service and helpdesk
Open tickets by priority, resolution time, repeat issues and workload per team.
How we deliver a BI project
Short iterations keep dashboards aligned with how managers actually decide.
Define decisions and KPIs
For each role we list the decisions, then the KPIs, formulas, filters and owners behind them.
Audit the data
We test whether Odoo data supports each KPI and fix entry rules where it does not.
Model and connect
We build Odoo views and dashboards, or a Power BI model fed through a read-only connection.
Reconcile
Totals are checked against the trial balance, stock valuation and sales reports before release.
Roll out and review
Users get access by role, short training and a review after the first reporting cycle.
What every KPI definition should include
Writing these down prevents most disputes about numbers.
- Name and business question it answers
- Exact formula and units
- Source models and fields in Odoo
- Included and excluded transactions
- Refresh frequency
- Owner responsible for the number
- Who is allowed to see it
Odoo dashboards or Power BI?
Use Odoo's own reporting when users need live operational views next to the transactions, such as a sales manager drilling from a pivot into the quotation. Choose Power BI when analysis combines Odoo with other systems, needs historical snapshots or complex measures, or must be shared with people who do not use Odoo. Many companies use both: operational views in Odoo, management and group reporting in Power BI.
Frequently asked questions
How is Power BI connected to Odoo?
Common options are a read-only database user or replica, the Odoo external API, or scheduled exports to a reporting store. The right option depends on hosting, data volume and security policy; on Odoo Online, direct database access is not available, so API-based or export-based methods are used.
Can we see dashboards on mobile?
Yes. Odoo dashboards work in the mobile browser and app, and Power BI has its own mobile app. We design key dashboards with a simplified mobile layout for managers who review numbers on the move.
Our numbers in Odoo do not match our accountant's reports. Can BI fix that?
A dashboard alone will not. We first trace the difference to its cause, such as posting rules, unreconciled entries or stock valuation settings, fix it in Odoo, and then build reports on the corrected data.
Who can see which numbers?
Access follows roles. In Odoo, record rules and groups restrict data by company, branch or team; in Power BI, workspace permissions and row-level security can do the same. Salary and margin data are typically restricted to named roles.
Want numbers your managers agree on?
Request a needs-analysis session. We will review your KPIs and data quality and propose dashboards for each role.